





E-bike sales continue to grow faster than the overall bicycle market, with US sales in the millions of units per year, European markets showing double-digit growth, and e-bikes now accounting for a significant share of new bike sales in key markets; the trend is driven by commuting cost savings, urban congestion, and the expansion of class-based e-bike laws. This guide summarizes the market numbers with their sources and connects them to what they mean for buyers.
The Statistics and Why They Matter to Buyers
| Metric | What it shows |
|---|---|
| US sales volume | Millions of units per year |
| European growth | Double-digit in several markets |
| E-bike share of new bike sales | Large in mature markets |
The adoption numbers answer the practical question behind most purchases: is an e-bike a durable category or a passing trend? A market that has grown for years, with a real installed base, supports the things a buyer actually depends on: replacement parts, service knowledge, resale value, and continued innovation. The statistics also explain the legal environment, because widespread adoption is what pushed states to define e-bike classes, which is the framework every buyer now navigates. The numbers are context, and the context changes the confidence of the purchase.
The adoption numbers matter because they answer the practical question behind most purchases: is an e-bike a trend or a proven category? The data shows a market that has grown consistently for years, with sales volumes that support a mature parts and service ecosystem. A buyer looking at a $799-1,500 e-bike is buying into a category with a real installed base, which is what makes parts, support, and resale viable.
The Market Size Numbers Behind the Trend
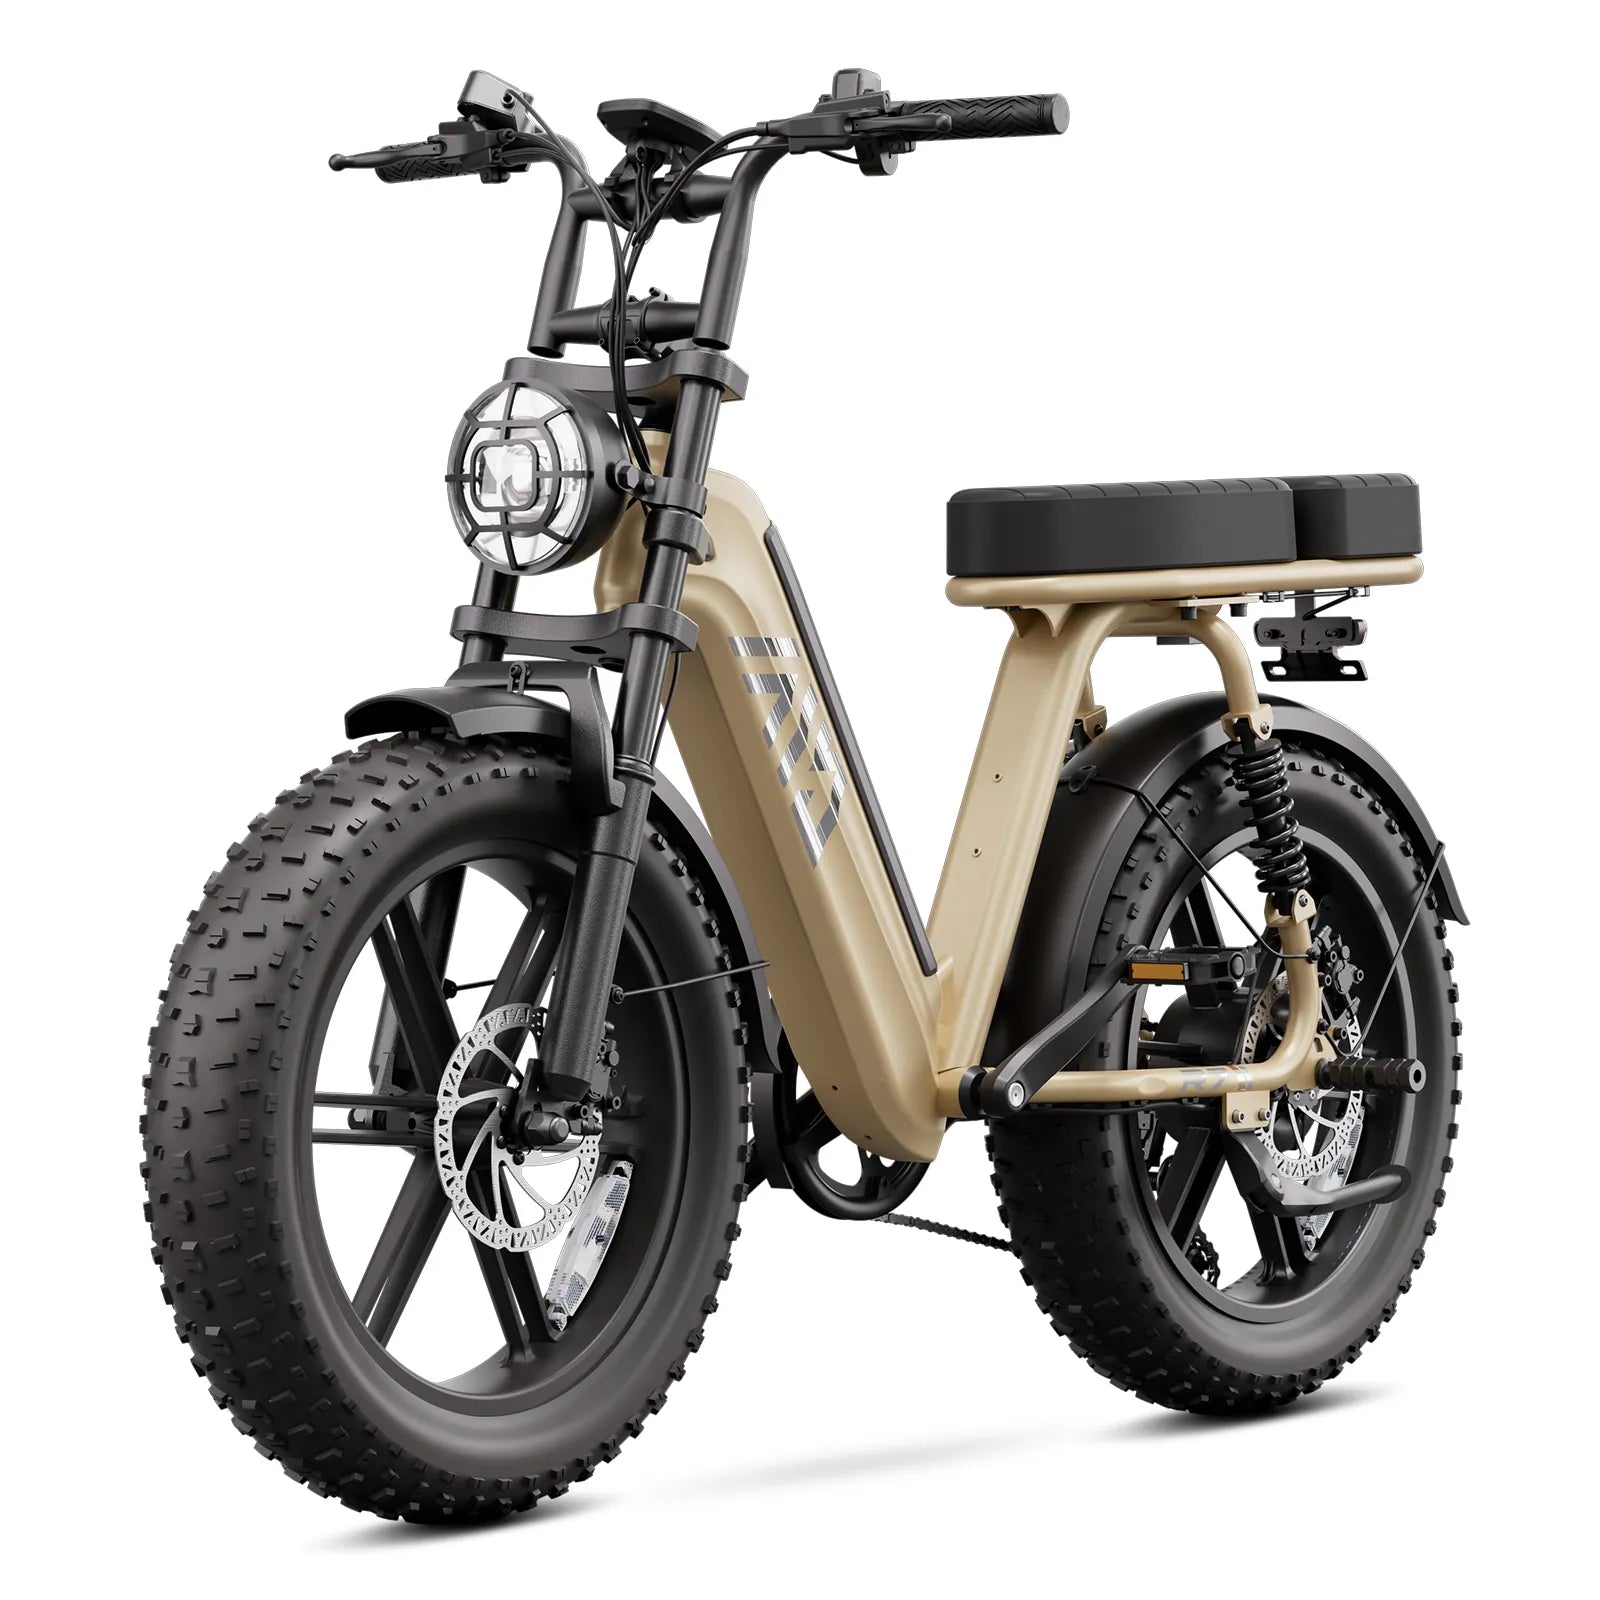
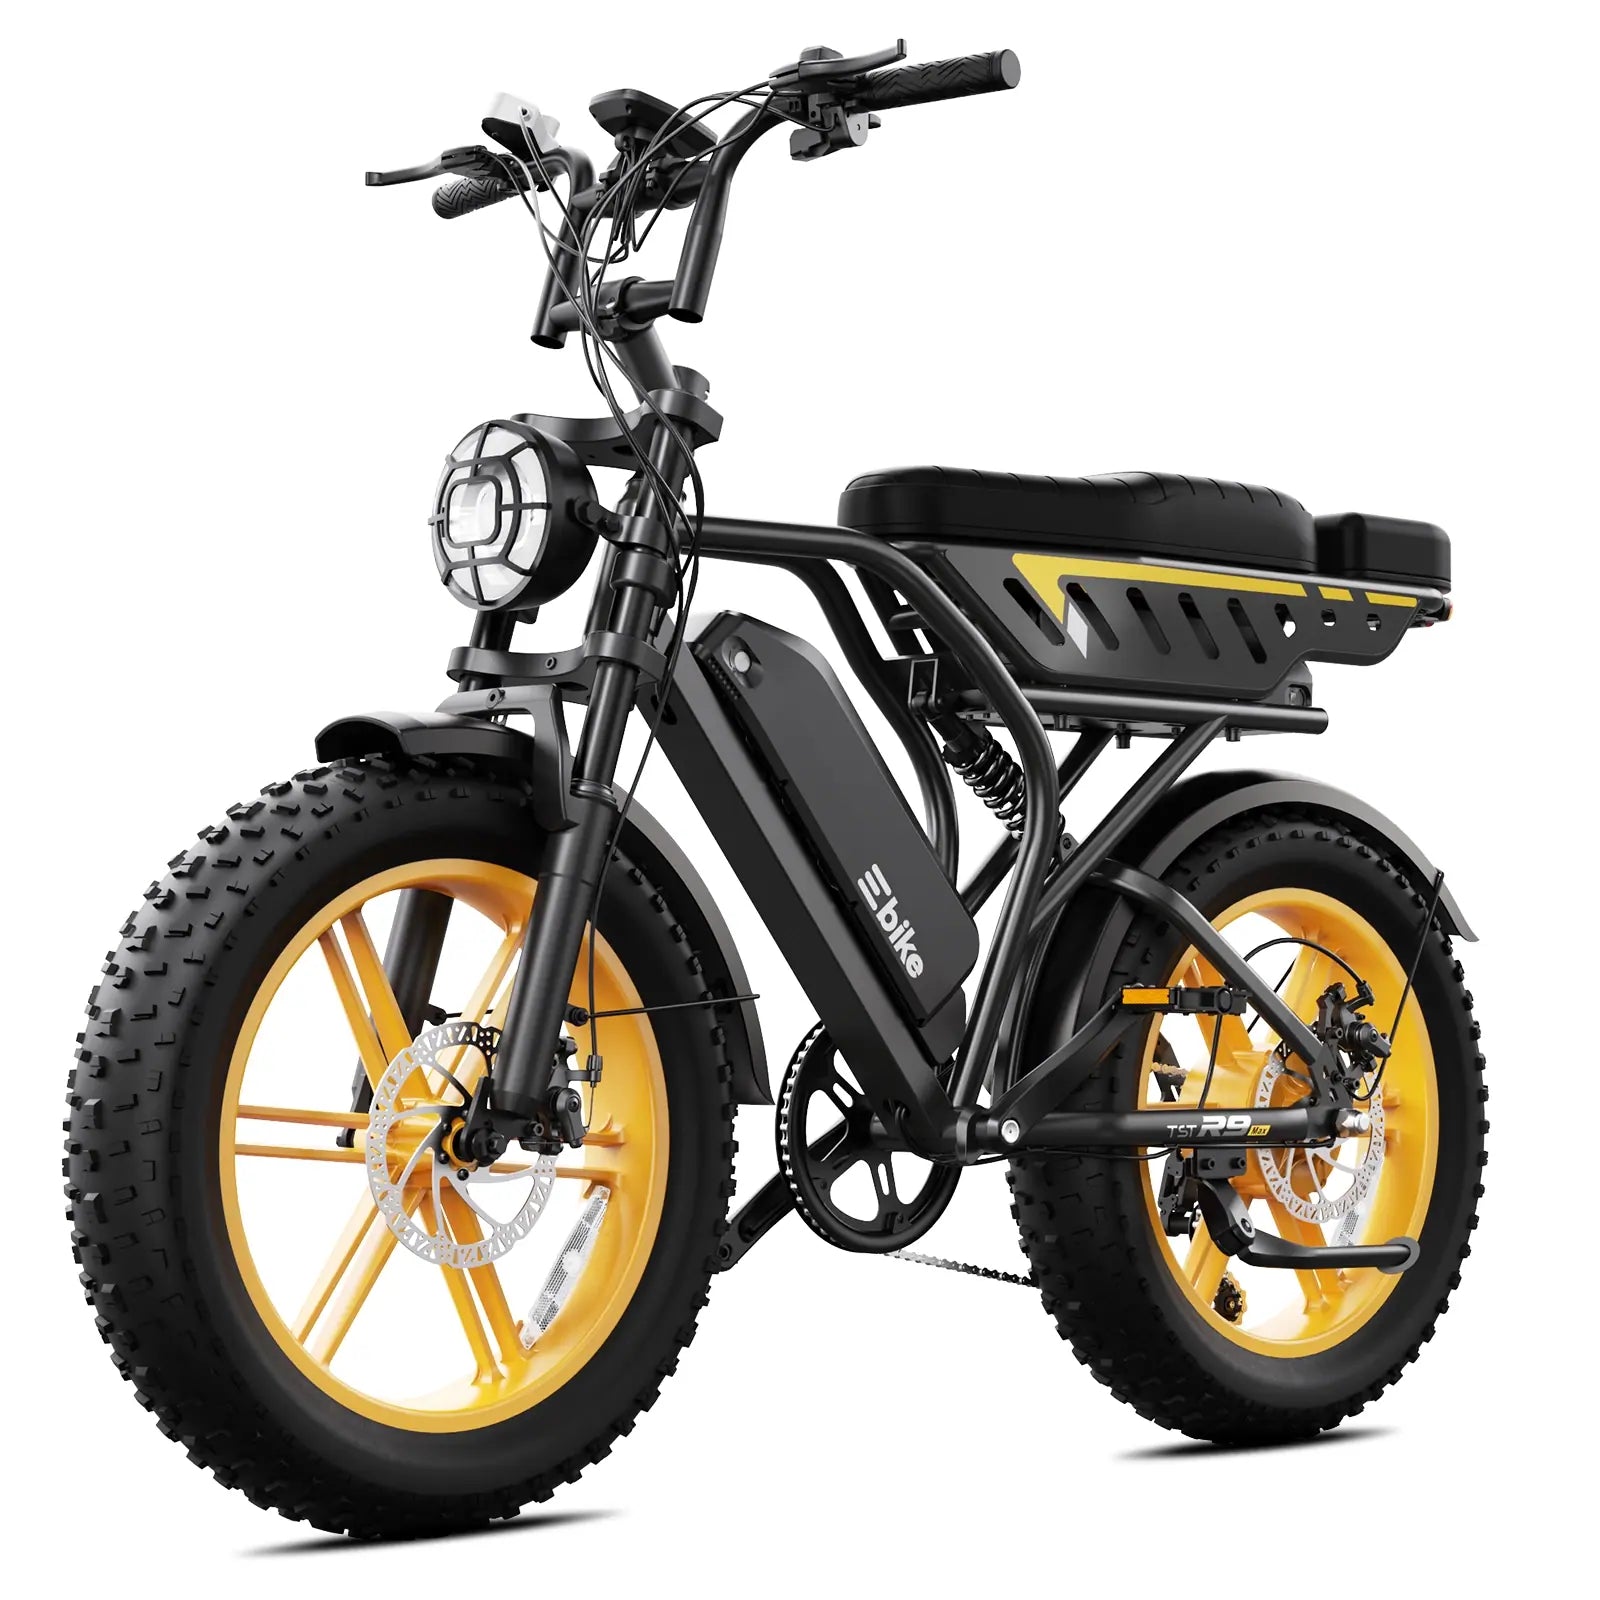
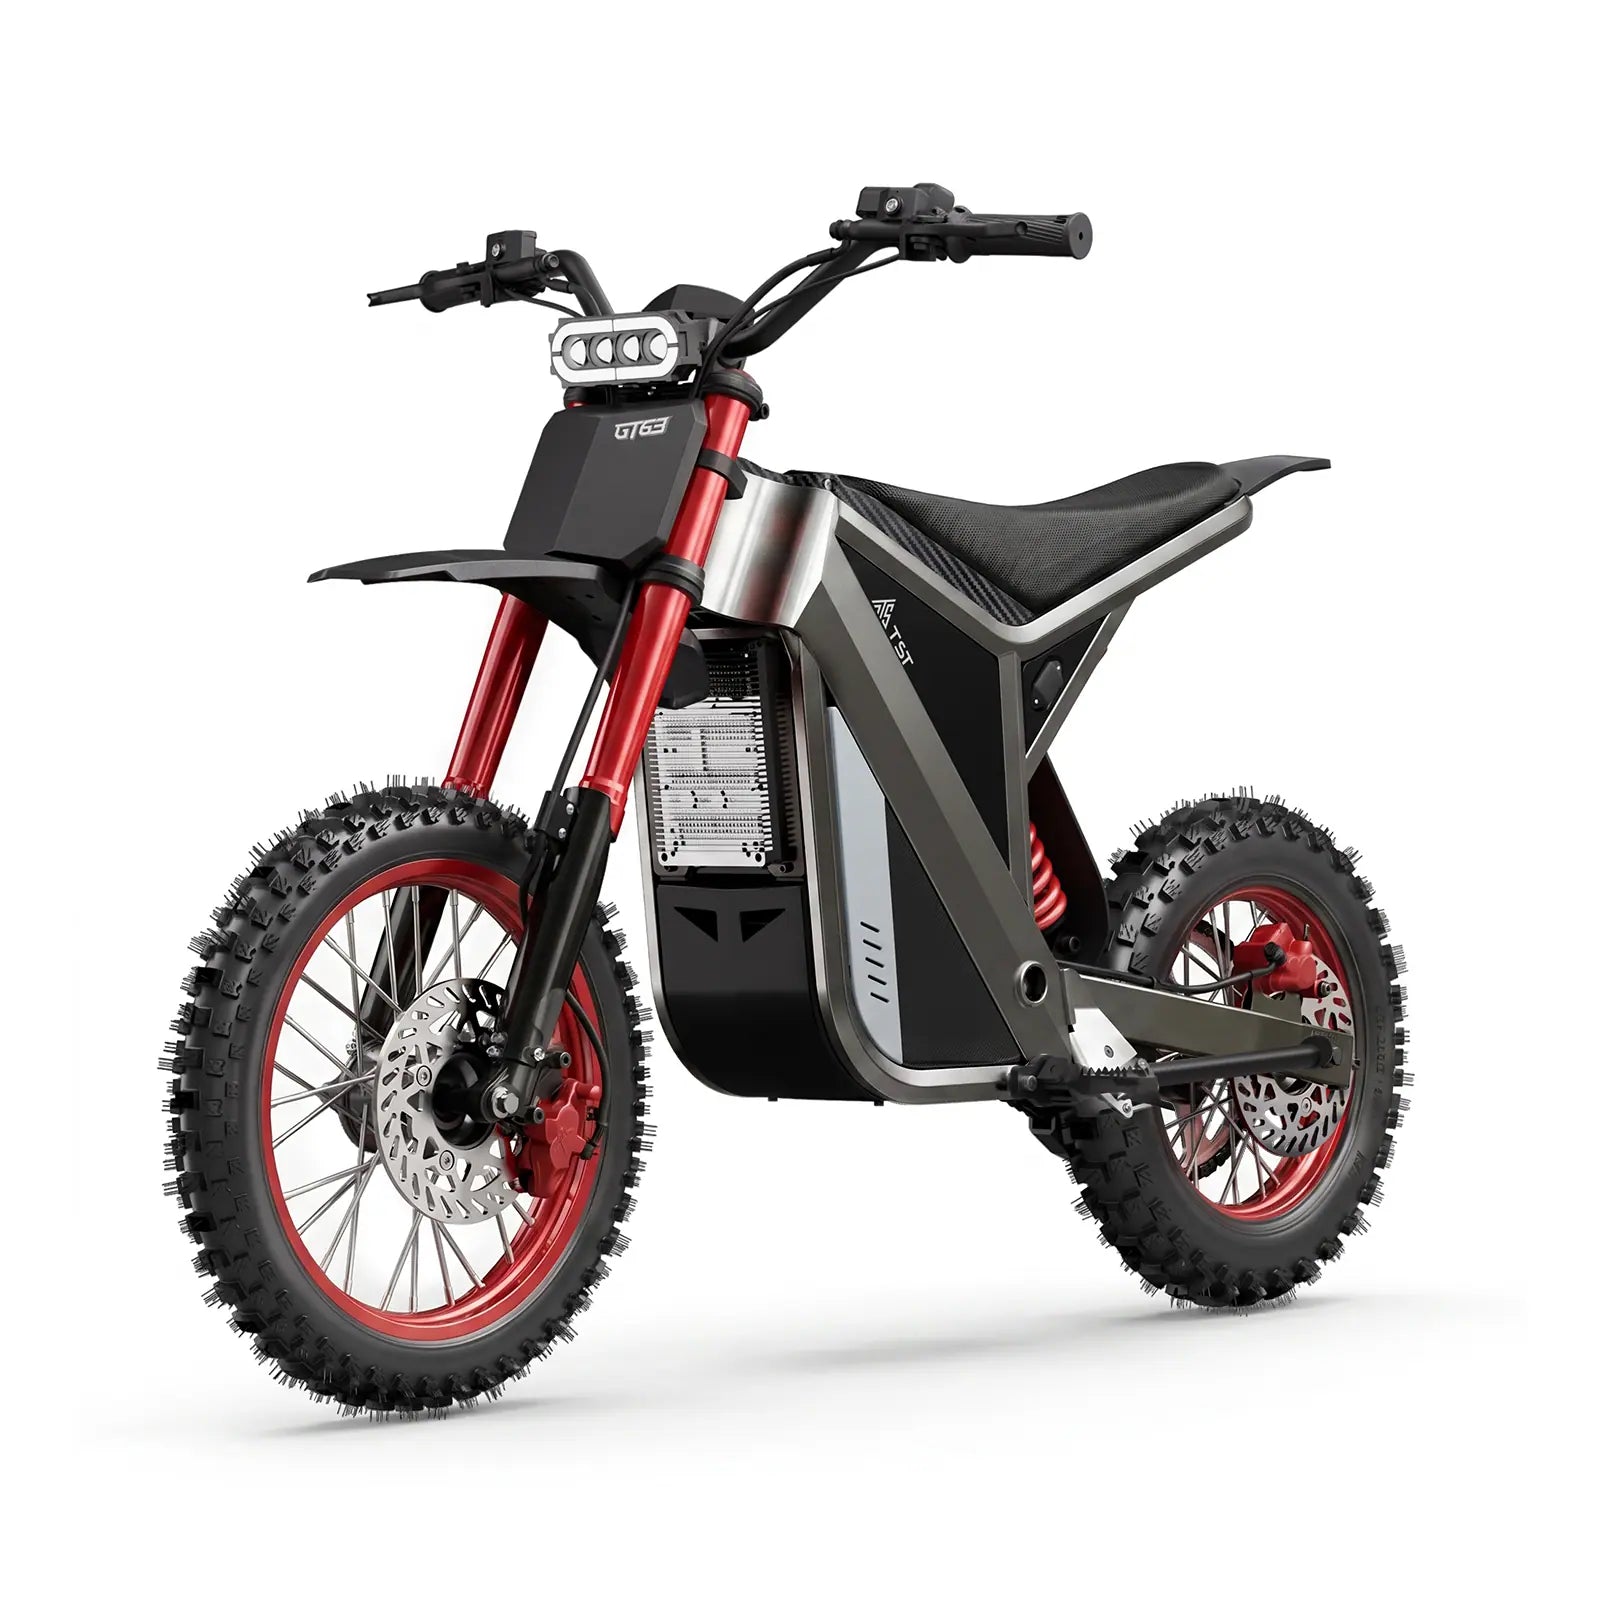
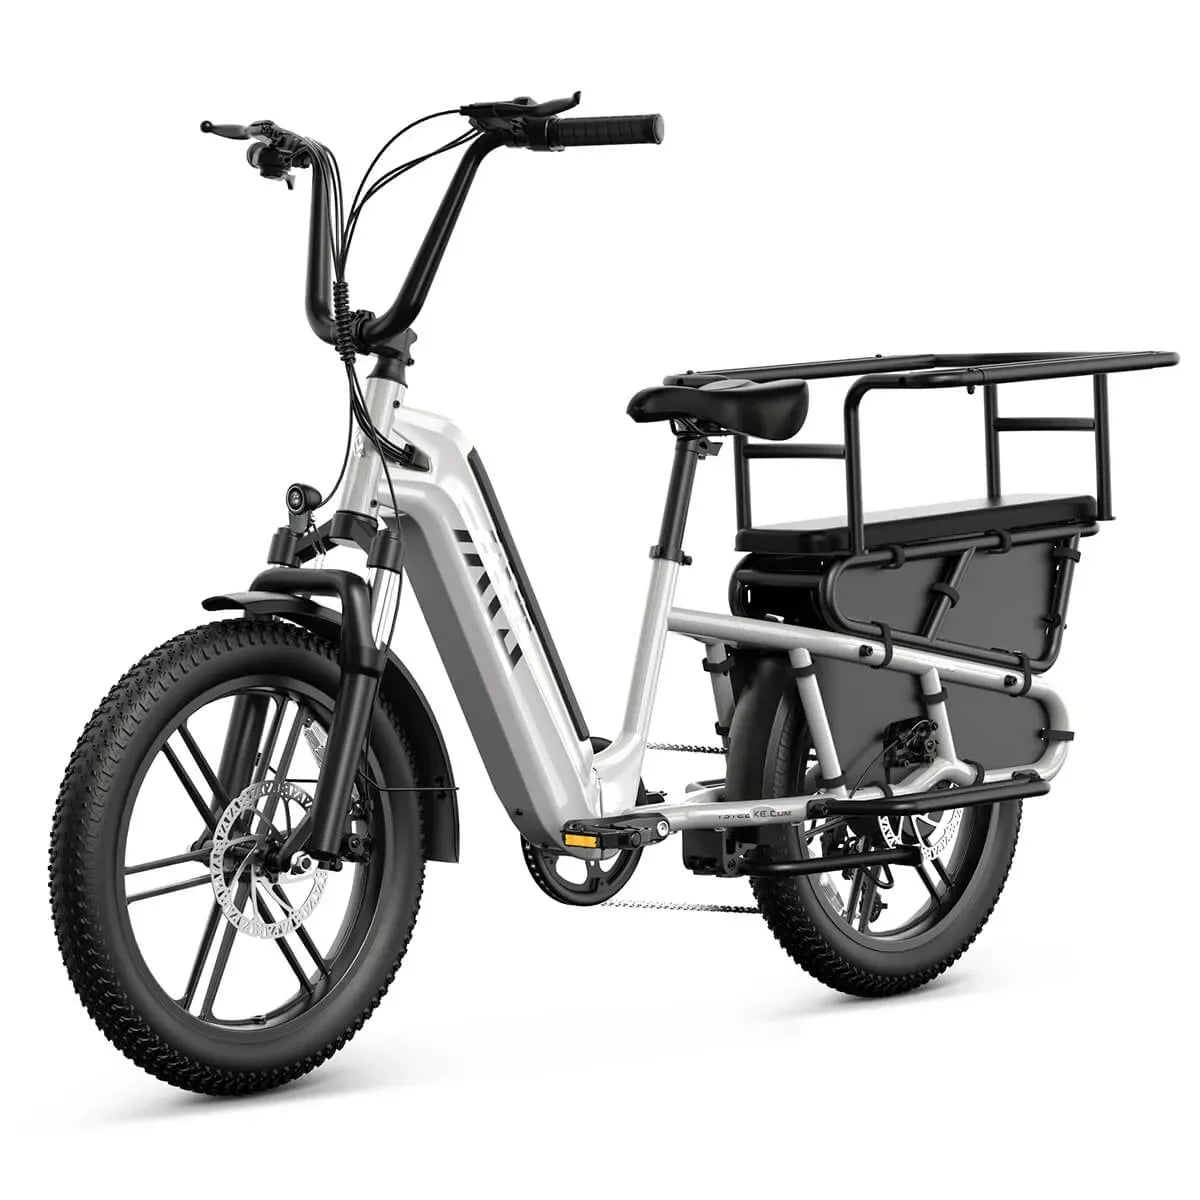
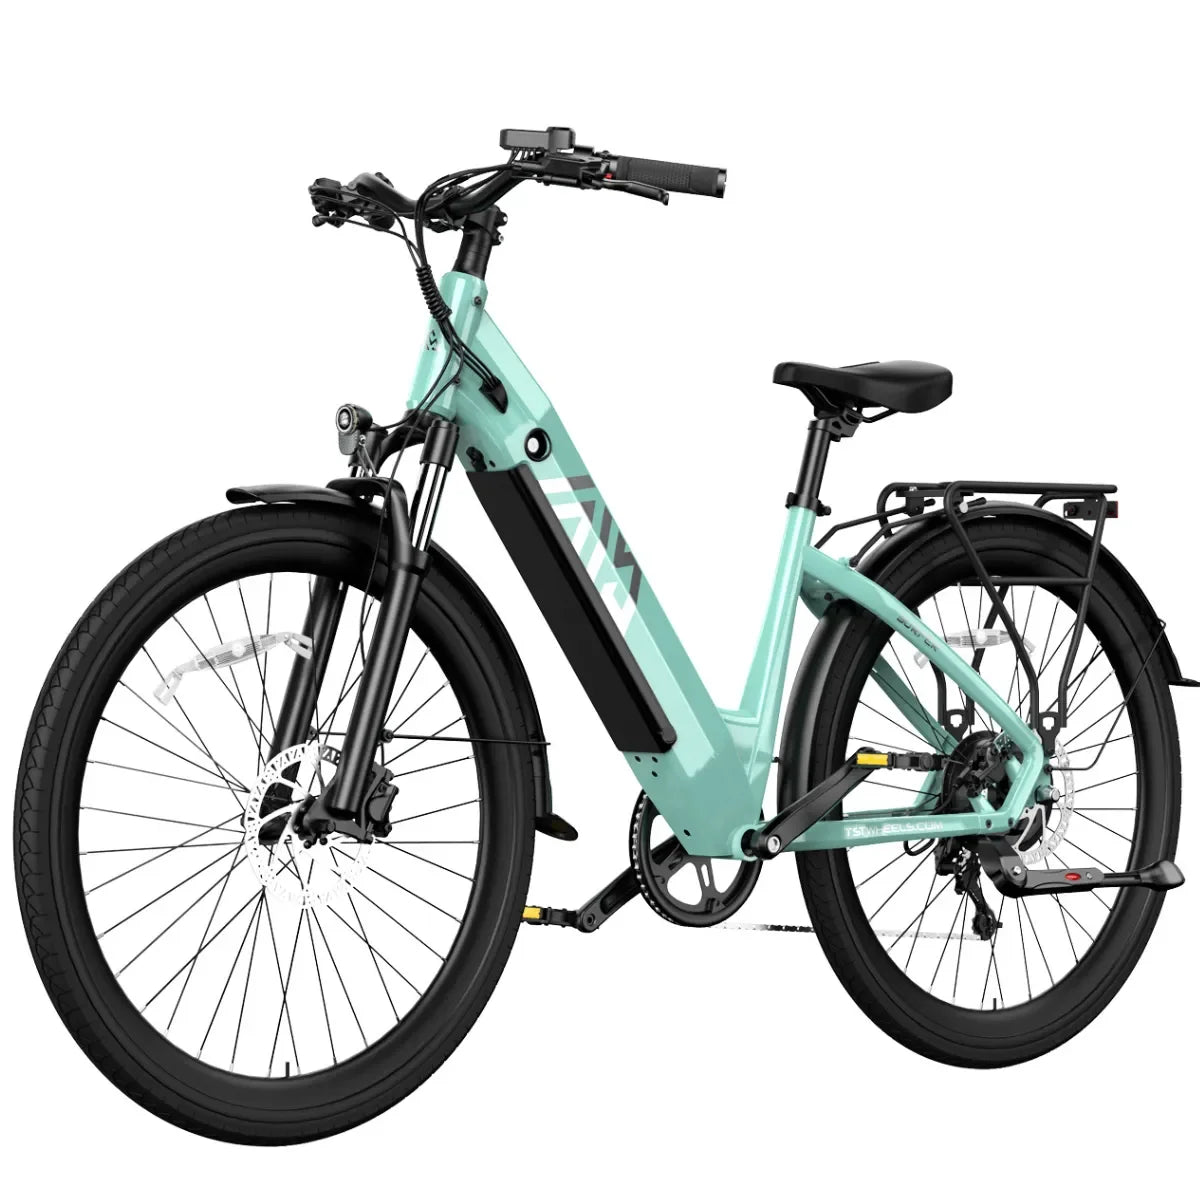
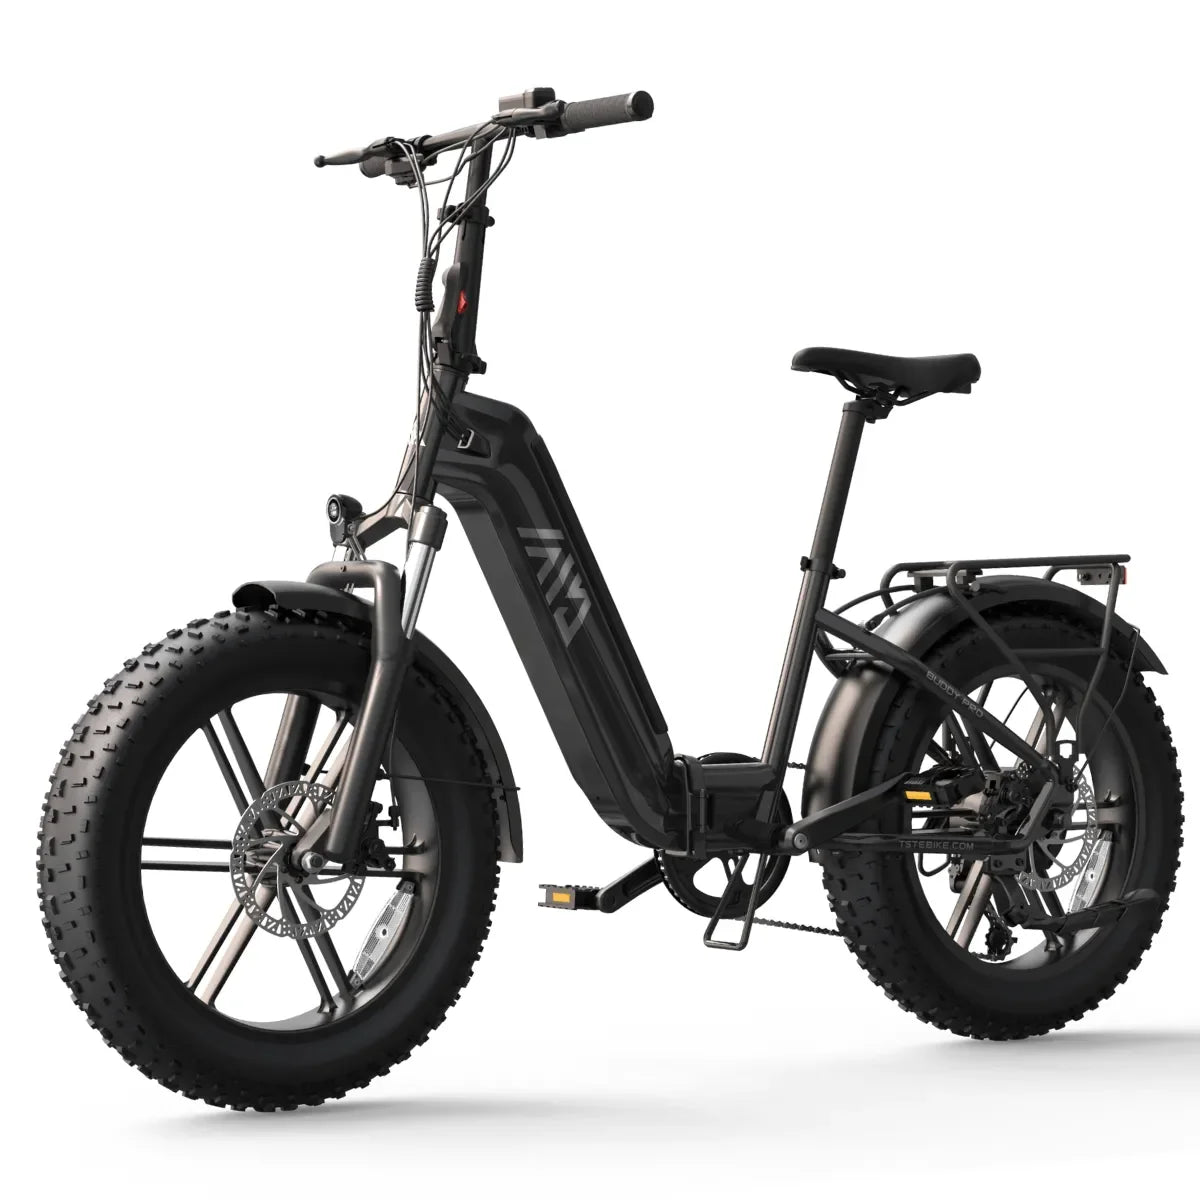
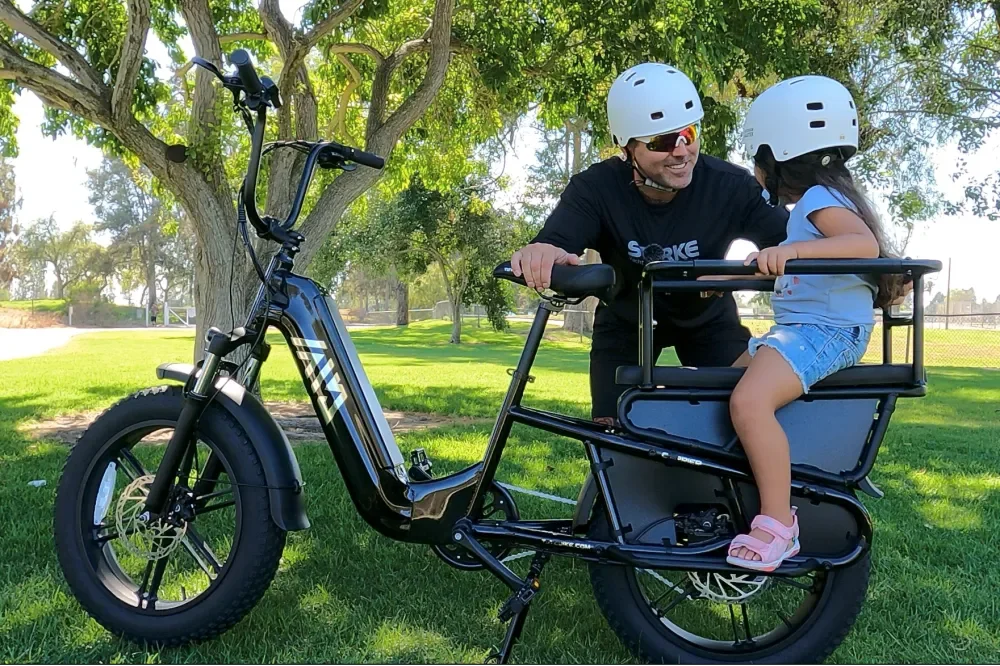
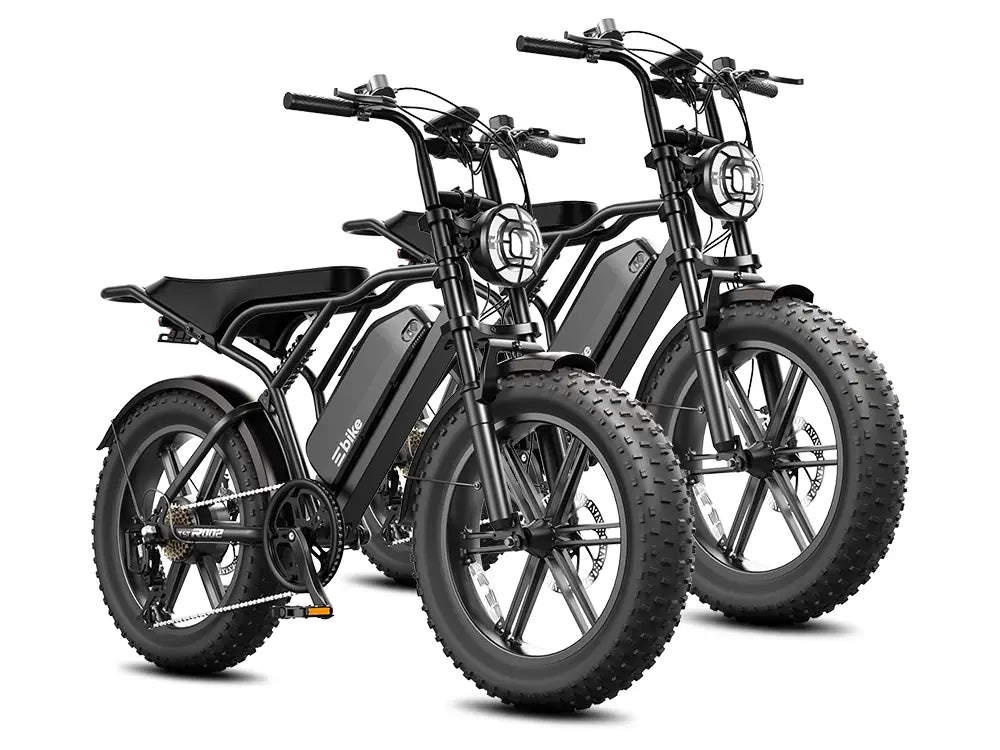
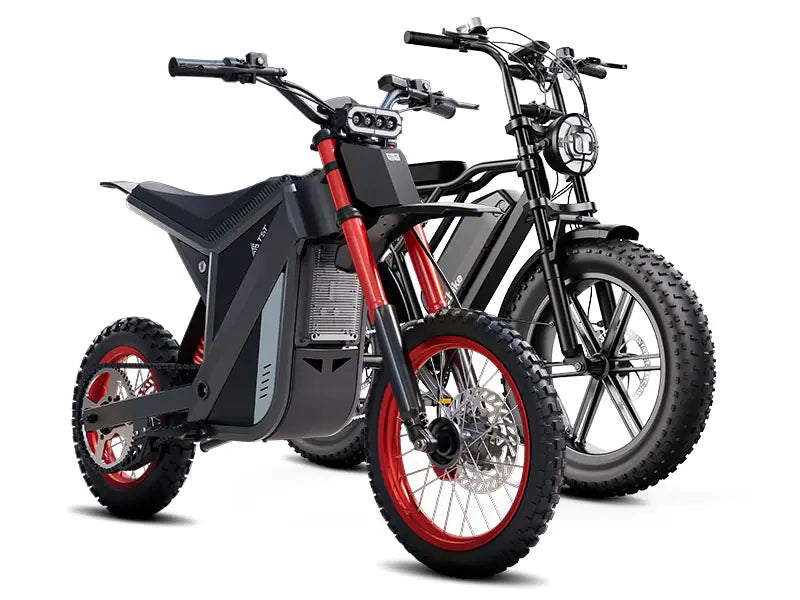
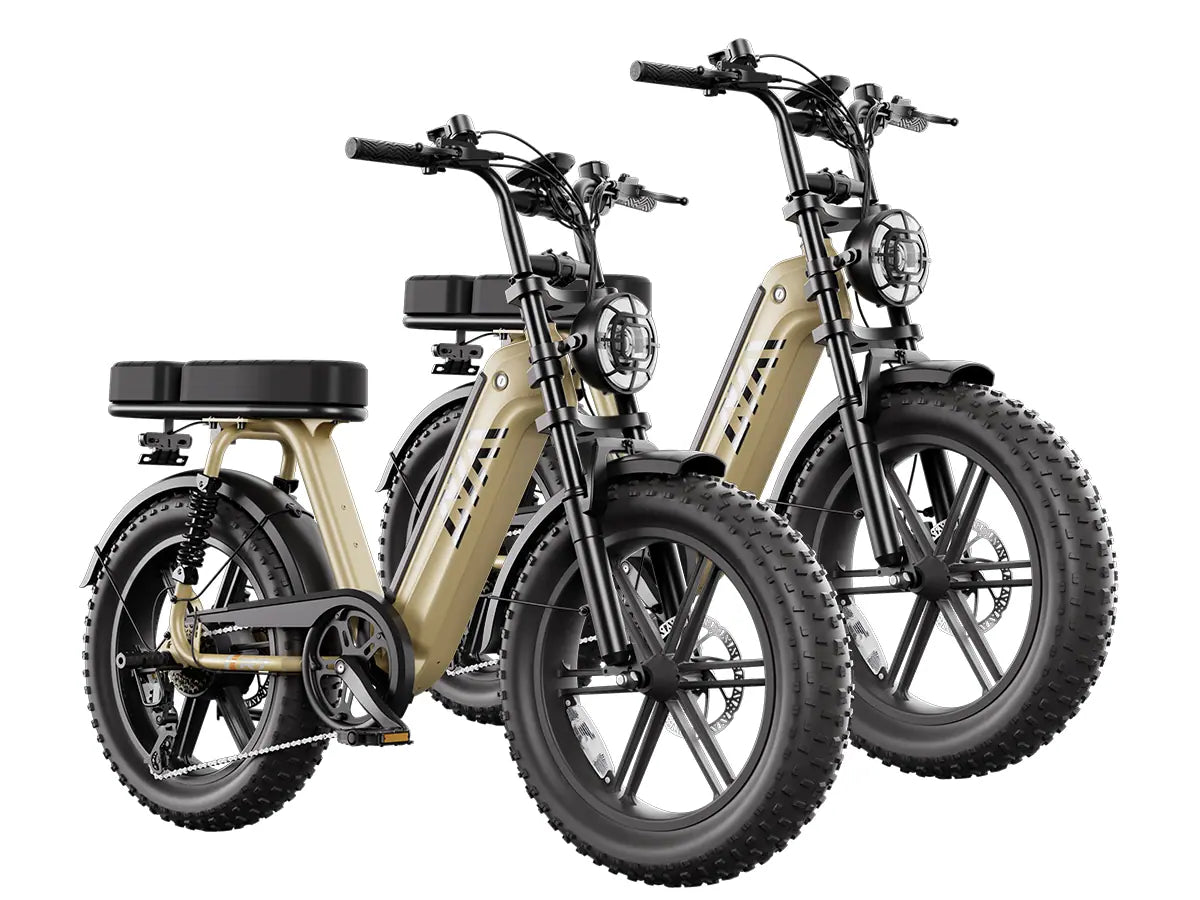
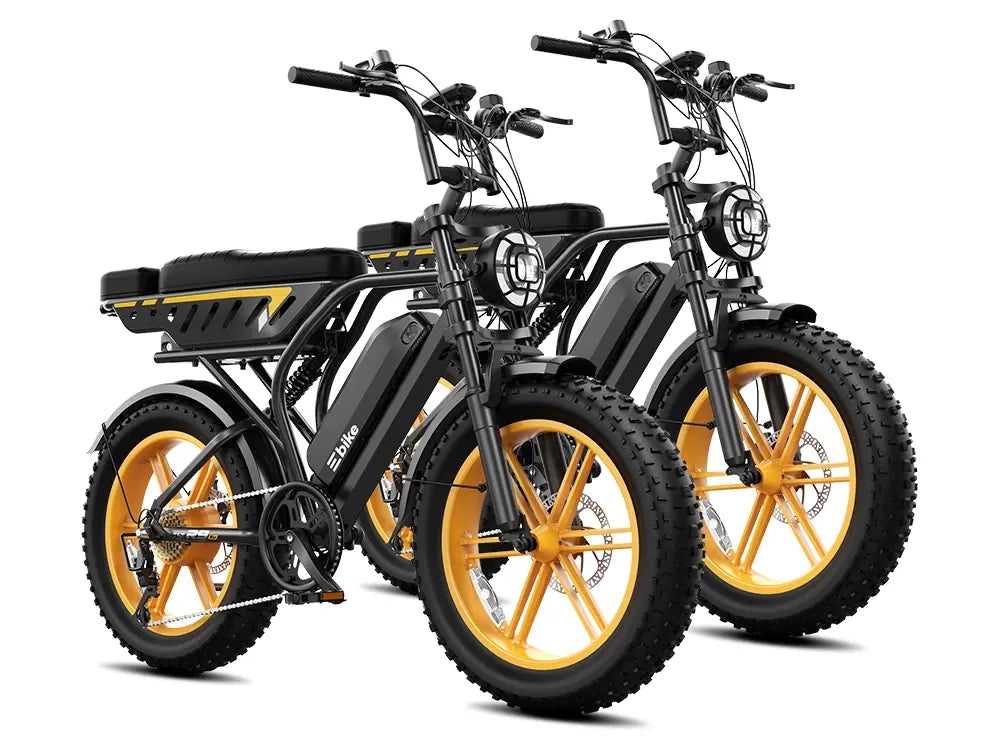
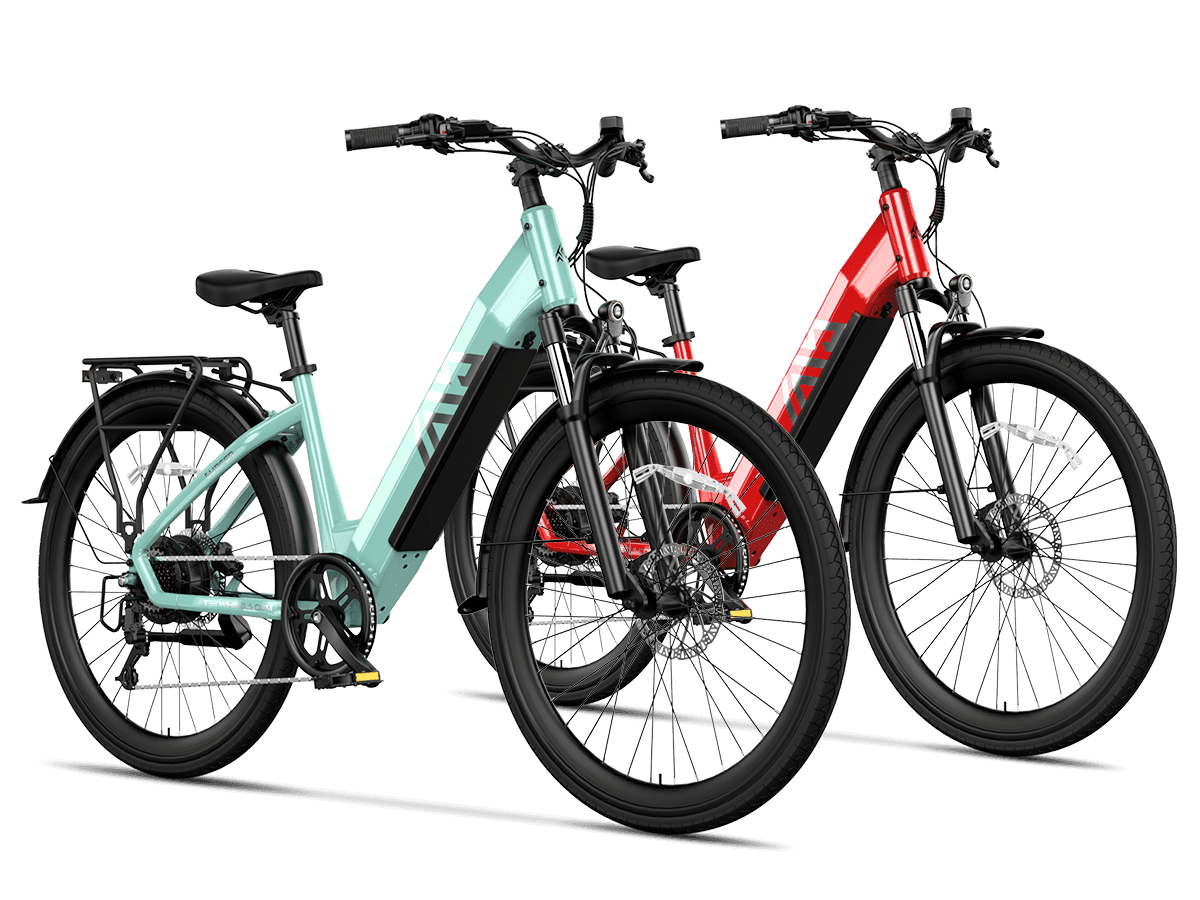
TST EBike's own growth, from a 2017 California startup to sales in over 10 countries, is a small case study inside the larger trend, and the brand's published lineup reflects the category's expansion.
The size numbers put the trend in perspective: sales in the millions of units in the US, double-digit growth in several European markets, and e-bikes as a large share of new bike sales where adoption matured. The exact figures vary by report because the definitions and methods differ, which is why the sources are cited rather than a single number presented as fact. The pattern across the reports is the reliable signal: the category is large, growing, and established enough to support the parts and service ecosystem a buyer depends on.
The headline figures come from industry reporting: US e-bike sales have grown from hundreds of thousands of units annually to the millions, European sales have shown sustained double-digit growth in several countries, and e-bikes now represent a meaningful share of new bicycle sales in markets like Germany and the Netherlands. The exact numbers vary by report and year, which is why this guide cites sources rather than a single unverifiable figure.
The Drivers Behind E-Bike Adoption Growth
The three drivers reinforce each other: commuting economics makes the e-bike the rational choice for short trips, congestion makes it the fast choice in cities, and the class-based laws make it the legal choice without the moped paperwork. Each driver is visible in the data, from the share of trips replaced to the growth of sales in cities with bike infrastructure. The combination is why the market keeps growing even as other bike categories flatten, and it is the same logic that appears in the cost study in this series.
The growth has three documented drivers: commuting economics, because an e-bike costs a fraction of a car to own and run; urban congestion, because bike lanes and short trips make e-bikes faster than driving in many cities; and the spread of class-based laws, which give buyers a clear legal framework. Each driver appears consistently in the industry data and the commuting research cited across the market reports.
E-Bike vs Bicycle Market: The Share Numbers
The share comparison tells the story: in markets with mature e-bike adoption, e-bikes account for a large share of new bike sales, while in the US the share is smaller but growing rapidly. The difference reflects infrastructure and policy, not consumer preference, and it suggests the US market has room to follow the European pattern. Buyers can read the share numbers as a signal of where the category is heading.
The Commuting Data and What It Shows About Riders
The commuting numbers are the most directly relevant to a buyer: e-bike owners report replacing car trips, the 3-10 mile range is the most common commute band, and the cost savings from replacing even a few car trips per week cover the bike's purchase within a couple of years. The data also shows the pattern behind the trend, with riders using e-bikes for the short daily trip and cars for the longer or heavier journeys. The cost study in this series runs the full model, and the statistics provide the population-level context behind it.
The commuting data shows the same trend: e-bike owners report replacing car trips, with commute distances in the 3-10 mile range the most common, and the cost savings from replacing even a few car trips per week covering the bike's purchase within a couple of years.
How Should You Read the Numbers Skeptically?
The honest reading treats statistics with context: sales growth is not the same as ownership rates, European numbers do not transfer directly to the US, and a headline figure without a source is marketing. Check whether the number comes from an industry association, a market research firm, or a retailer's own claim, because the source determines the reliability. This guide links the sources so readers can verify the figures themselves.
What Do the Numbers Mean for TST EBike Buyers?
For a TST EBike buyer, the adoption data supports the value story: a growing market means a growing installed base, which supports the brand's direct parts catalog and the resale of used bikes. The category's maturity is also why the legal class check matters, because adoption has driven the state-by-state regulation covered in the laws pillar in this series. The statistics are the context; the spec sheet is the decision.
The Original Sources Behind Each Figure
The source habit matters because e-bike statistics move quickly and headlines age fast: a number from two years ago may be half the current market, and a claim without a source is impossible to update. The reliable anchors are the industry associations that publish annual sales reports, the market research firms that track unit volumes, and the government agencies that publish commuting and energy data. Bookmark those sources, check the publication date, and update the numbers each year, which is exactly how this guide stays current rather than becoming another stale statistic page.
The reliable starting points are industry associations, market research firms, and government transportation data, each publishing annual updates that this guide links. The U.S. energy and transportation agencies publish commuting and cost data, industry bodies publish sales reports, and research firms publish market-size estimates. Bookmark the sources and update the numbers each year, because the category is moving quickly.
TST EBike Expert Views
"The market data is the context for every purchase, and the honest way to read it is with sources and a date. Sales growth, commuting adoption, and the spread of class-based laws all point the same direction, and the trend is what supports the parts and service ecosystem a buyer relies on. We publish our specs and our story the same way we expect the market data to be published: verifiable and current."
— TST EBike Product Research Team (this article is written by TST EBike's editorial team, which works for the manufacturer)
Conclusion: The Data Says the Category Is Real and Growing
E-bike adoption statistics show a market growing faster than the overall bicycle market, driven by commuting economics, congestion, and clearer laws, with the US following a pattern Europe has already demonstrated. Read the numbers with sources, connect them to your own commute, and treat the category's maturity as supporting evidence for your purchase.
Data-Reading Checklist
The market data, the commuting data, and the legal context together tell the story of a category that is here to stay.
The bottom line: the adoption numbers confirm the category is real and growing, and the buyer who reads them with sources and connects them to a commute gets the context that makes the purchase decision confident.
The statistics are context, and the context matters only if it is current and sourced, so update the numbers each year from the linked reports rather than repeating last year's headline.
- [ ] Check the source of every statistic.
- [ ] Separate sales growth from ownership rates.
- [ ] Compare US data with international patterns.
- [ ] Connect the numbers to your commute economics.
- [ ] Update the figures annually from the linked sources.
See the commuting e-bike collection for models matched to the trends, and the all-electric-bikes lineup for the complete range behind the market numbers.
Related reading: the full e-bike versus car cost study
FAQs
Is the e-bike market growing?
Yes, e-bike sales have grown faster than the overall bicycle market for several years, with double-digit growth in several European markets and strong US growth.
How many e-bikes are sold in the US?
Annual US sales have grown to the millions of units per year per industry reporting, with the exact figure varying by report and year.
Why are e-bikes being adopted so quickly?
Commuting cost savings, urban congestion, and the spread of class-based e-bike laws are the three documented drivers of adoption.
Where can I find the original statistics?
Industry associations, market research firms, and government transportation agencies publish the underlying data; this guide links them for verification.

Leave a comment
This site is protected by hCaptcha and the hCaptcha Privacy Policy and Terms of Service apply.